Due to heavy rain, deliveries are delayed and couriers are not picking up orders. We're working to resolve this and appreciate your patience.
Thank you for your understanding.
Due to heavy rain, deliveries are delayed and couriers are not picking up orders. We're working to resolve this and appreciate your patience.
Thank you for your understanding.
Due to heavy rain, deliveries are delayed and couriers are not picking up orders. We're working to resolve this and appreciate your patience.
Thank you for your understanding.
Due to heavy rain, deliveries are delayed and couriers are not picking up orders. We're working to resolve this and appreciate your patience.
Thank you for your understanding.
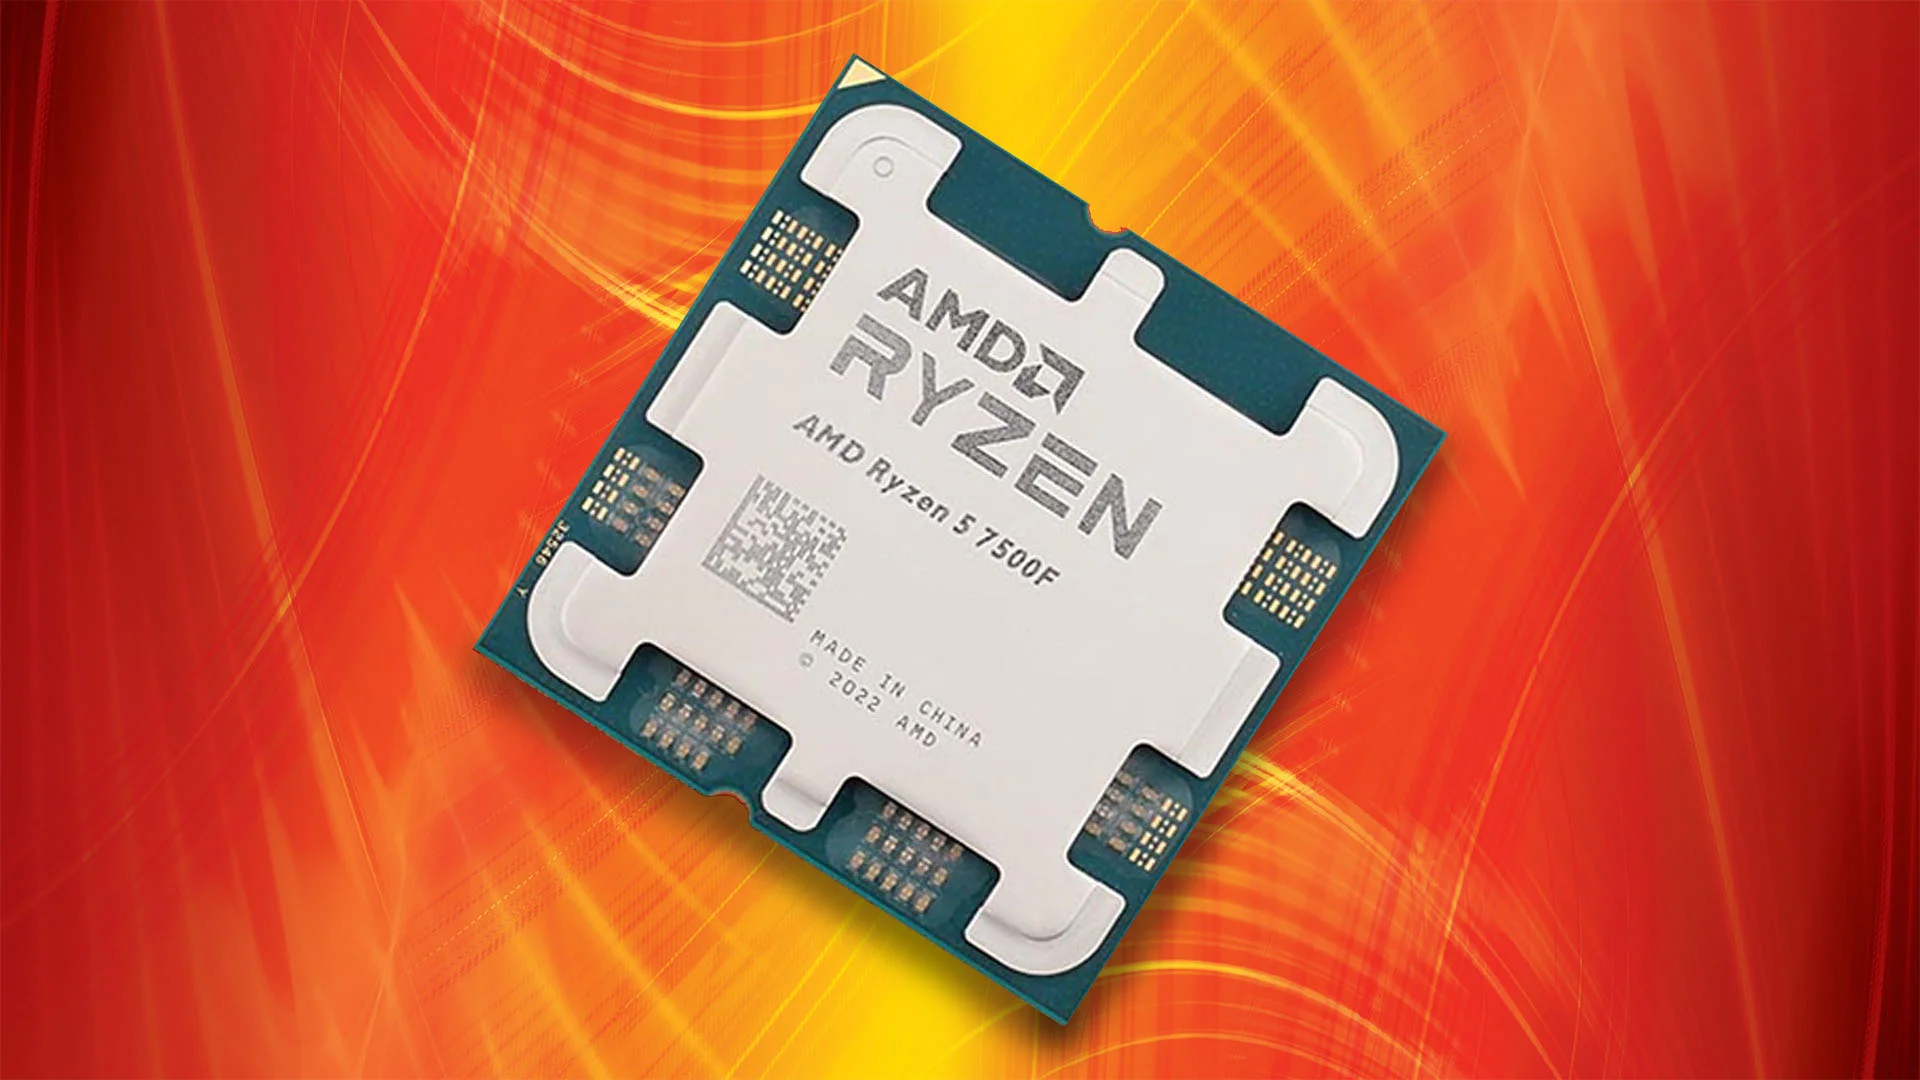
Comments Off on The AMD Ryzen 5 7500F offers excellent value for gaming enthusiasts, provided that you are able to purchase it.
AMD’s latest Ryzen 7000 processors are known for their exceptional gaming performance. The Ryzen 5 7600 and Ryzen 5 7600X CPUs, while considered entry-level, still come with a significant price tag of and respectively. However, the new Ryzen 5 7500F offers a more affordable option at in the US or in the UK when paired with an A620 motherboard worth, making the CPU itself around. This model slightly reduces frequencies by 100MHz and eliminates integrated graphics, but provides a lower purchase price.
AWD-IT, a British system builder, is among the select few retailers that offer the chip. They have provided us with the chip, along with its bundled AMD Wraith CPU cooler, for testing purposes. Our team has conducted various game benchmarks and content creation workloads to evaluate its performance against a variety of competitors, ranging from the budget-friendly Ryzen 5 7600X and Core i5 13400F to the premium Ryzen 9 7950X3D, Ryzen 7 7800X3D, and Core i9 14900K.
The inquiry we aim to address is straightforward: is there a compelling rationale to opt for the Ryzen 5 7600X or 7600 instead of the 7500F aside from wider availability in retail? Historically, the most affordable CPU within a specific core count in previous Ryzen iterations was typically the most cost-effective choice, but it is prudent to reassess that presumption with these latest Zen 4 components.
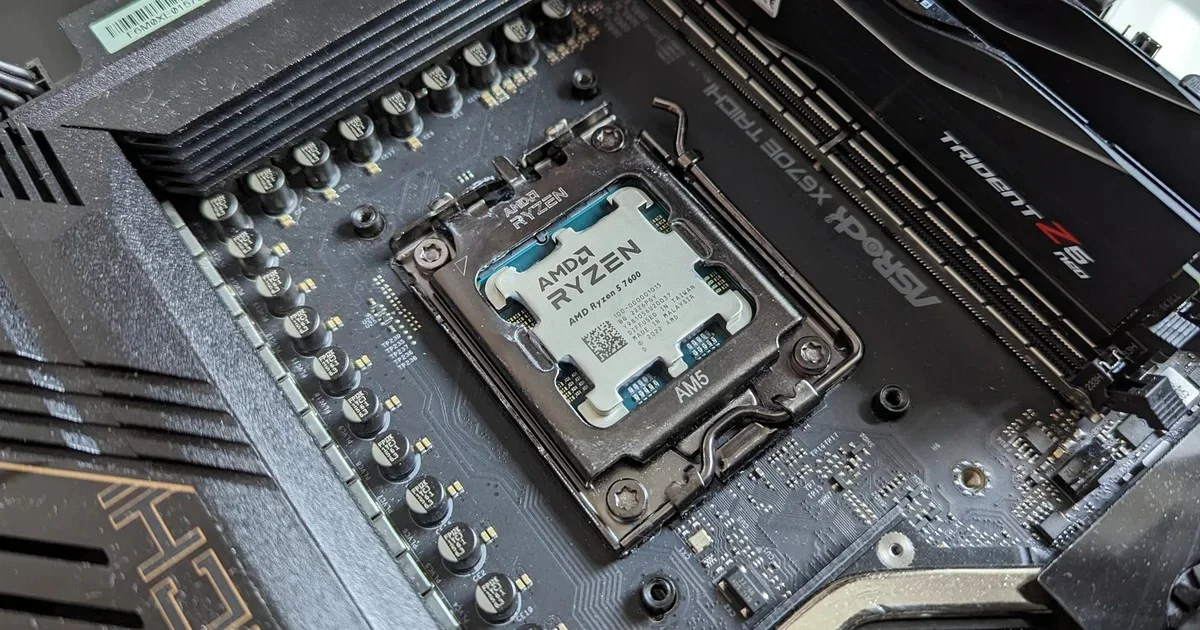
The Ryzen 5 7500F is installed in our ASRock X670E Taichi motherboard. | Image credit: Digital Foundry
The table above illustrates that the Ryzen 5 7500F and 7600 are closely matched, with a relatively small performance increase to the 7600X. In fact, the variance in quoted boost frequencies between the least and most expensive six-core Ryzen CPU is only 300MHz, or just over five percent.
The cache setup remains consistent, and all three hexa-core Zen 4 processors are compatible with PCIe 5.0 devices. This compatibility is not always guaranteed, as seen with the Ryzen 5600G which lacks support for PCIe 4.0 due to its origins in laptop processors.
The 7600X boasts a higher rated TDP, yet it can be adjusted to the 65W ‘eco’ setting like the 7500F if preferred. Conversely, the 7500F can have its power limits increased to equal those of the 7600X. Additionally, the 7500F does not include integrated graphics, a feature typically unnecessary for gaming-oriented setups with dedicated graphics cards.
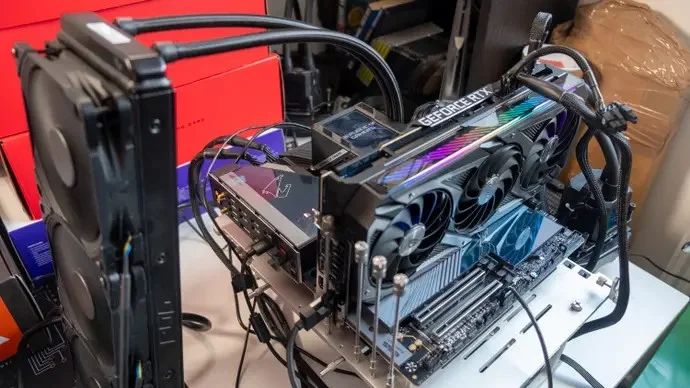
We are utilizing the identical fundamental configuration from our Ryzen 7800X3D evaluation for our testing. This includes the G.Skill Trident Z5 Neo DDR5-6000 CL30 RAM and Asus’ RTX 3090 Strix OC. Cooling is managed by an Eisbaer Aurora 240mm AiO. The ASRock X670E Taichi serves as our motherboard for AMD Ryzen 7000 CPUs, whereas the Gigabyte Aorus Z790 Master is responsible for our Intel CPUs.
We have opted for a 4TB Lexar NM790 PCIe 4.0 NVMe SSD for storage, which has shown significant improvement in benchmarking due to the recent decrease in NVMe SSD prices. Our system is powered by a 1000W Corsair RM1000x power supply. The testing phase included the installation of the latest Windows updates (22H2) and BIOS revisions (F11).
We decided to utilize a 4TB Lexar NM790 PCIe 4.0 NVMe SSD for storage, resulting in enhanced benchmarking performance following the recent price drop of NVMe SSDs. Our setup is complemented by a 1000W Corsair RM1000x power supply. Testing was conducted with the most recent Windows updates (22H2) and BIOS revisions (F11) installed.
Prior to delving into the gaming benchmarks found on pages two to four, let us first review a couple of content creation benchmarks: a Cinebench R20 3D render and a Handbrake video transcode. These benchmarks provide valuable insights not only for content creation tasks but also for understanding single-core and multi-core performance in different scenarios, even within a gaming context.
The Cinebench R20 single-thread benchmark demonstrates results slightly exceeding our expectations based on frequency alone, showcasing a six percent lead for the 7600 compared to the 7500F, and a 13 percent lead for the 7600X over the 7500F.
The competition is tight in the multi-core performance arena, with the 7600 holding a mere one percent advantage over the 7500F, while the 7600X leads the 7500F by a modest nine percent. It is anticipated that the performance gap will be narrower in gaming scenarios, where not all CPU cores and threads are fully utilized, especially as screen resolutions rise and GPU workload intensifies.
CB R20 1T
CB R20 MT
HB h.264
HB HEVC
HEVC Power Use
Ryzen 9 7950X3D
788
13807
95.73fps
40.70fps
232W
Ryzen 9 7950X
798
14837
105.15fps
45.10fps
368W
Ryzen 9 7900X
791
11324
79.38fps
33.77fps
288W
Ryzen 7 7800X3D
706
7108
52.99fps
23.14fps
190W
Ryzen 7 7700X
768
7894
56.69fps
25.95fps
266W
Ryzen 5 7600X
750
6063
44.35fps
20.28fps
236W
Ryzen 5 7600
706
5632
41.09fps
18.72fps
196W
Ryzen 5 7500F
665
5574
40.78fps
18.57fps
193W
Ryzen 9 5950X
637
10165
70.28fps
30.14fps
237W
Ryzen 7 5800X3D
546
5746
42.71fps
19.10fps
221W
Ryzen 7 5800X
596
6118
44.18fps
19.50fps
229W
Ryzen 5 5600X
601
4502
31.75fps
14.43fps
160W
Core i9 14900K
896
15962
103.12fps
41.20fps
433W
Core i5 14600K
800
9349
62.68fps
27.29fps
288W
Core i9 13900K
873
15570
104.67fps
41.20fps
473W
Core i5 13600K
767
9267
62.37fps
26.44fps
254W
Core i9 12900K
760
10416
70.82fps
29.26fps
373W
Core i7 12700K
729
8683
57.64fps
25.67fps
318W
Core i5 12600K
716
6598
44.27fps
19.99fps
223W
Core i5 12400F
652
4736
31.77fps
14.70fps
190W
Core i9 11900K
588
5902
41.01fps
18.46fps
321W
Core i5 11600K
541
4086
29.00fps
13.12fps
250W
In the Handbrake video transcode test, the 7600X outperforms the 7500F by nine percent in converting our sample file to both H.264 and H.265 encodes. The 7500F and 7600 are within the margin of error of each other. The higher frequency of the 7600X results in slightly higher power consumption compared to the lower-tier parts. The total system power peaks at 193W with the 7500F, 196W with the 7600, and 236W with the 7600X.
Let’s now delve into the core of our testing – a variety of games and scenes designed to assess your CPU in various ways. Choose your preferred titles from the provided links or simply click on the next page button to proceed.